Facts & Figures - Trustee Reports and Accounts
The Financial Accounts of the Wye and Usk Foundation can be viewed in their entirety by clicking on the following links and downloading the "pdf" file (size approx. 129kb).
Quick view/summaries of expenditure and income are shown below:-
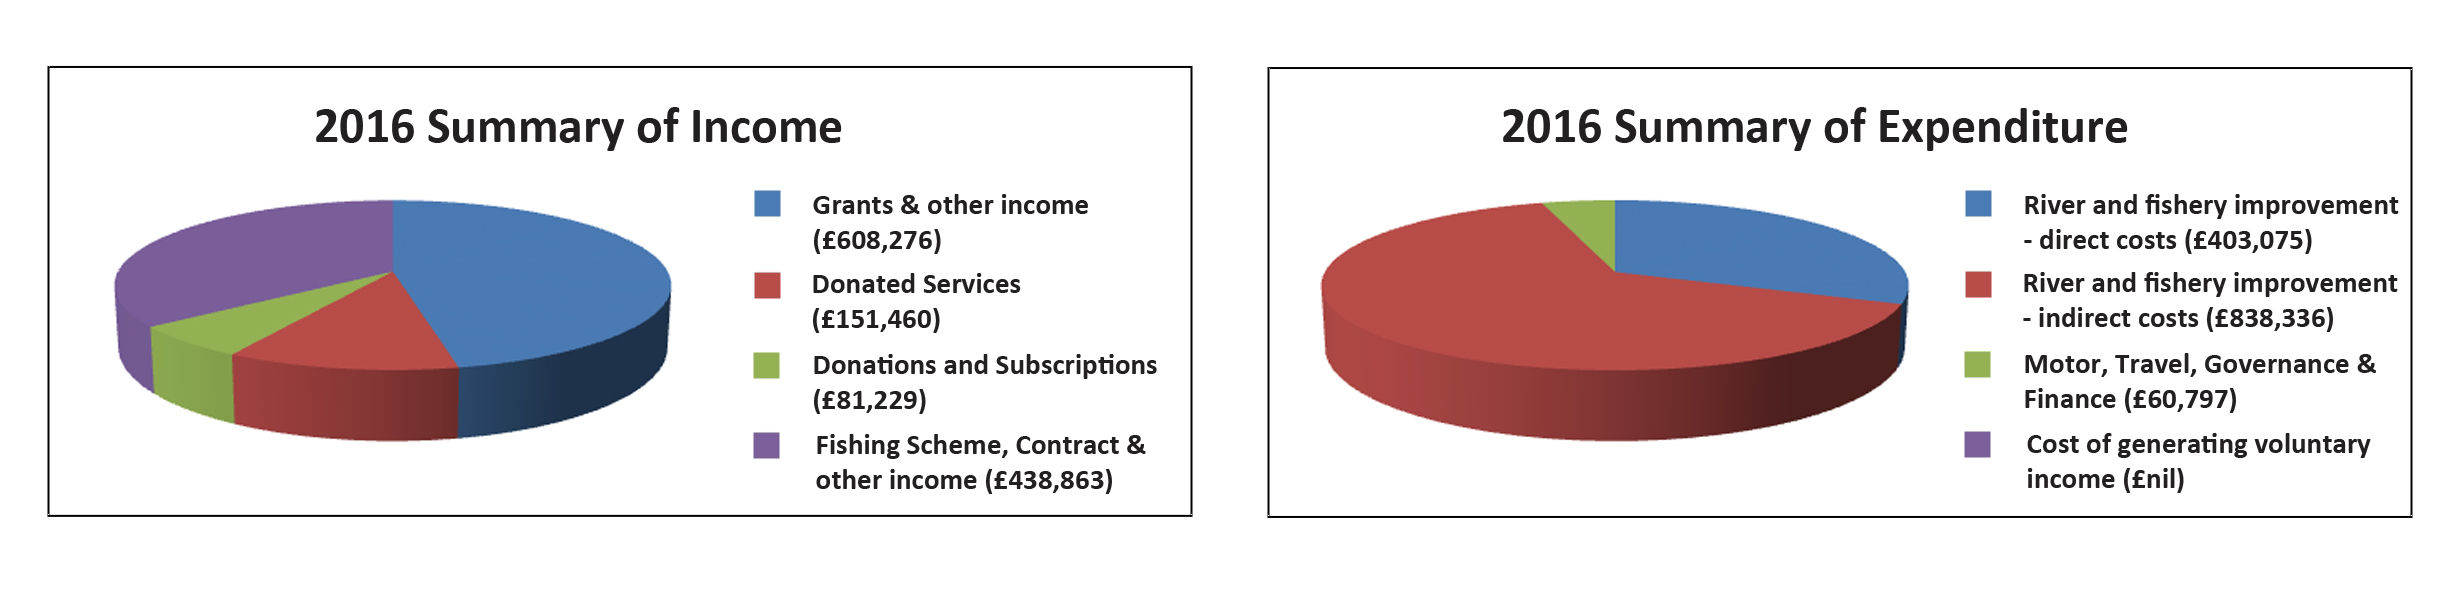
Summary of financial results for 2016
The statement of Financial Activities shows an excess of Expenditure over Income of £1,621.
The analysis of income and expenditure is shown in the pie charts below and is extracted from the report and accounts which are available via the link above.
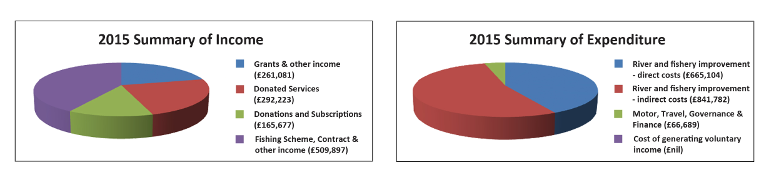
Summary of financial results for 2015
The statement of Financial Activities shows an excess of Income over Expenditure of £344,997.
The analysis of income and expenditure is shown in the pie charts below and is extracted from the report and accounts which are available via the link above.
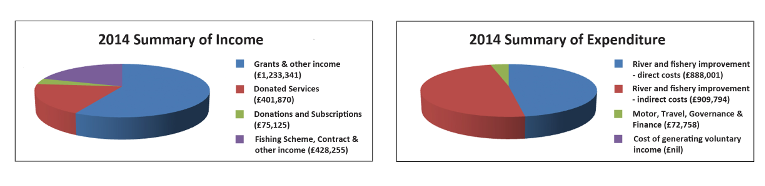
Summary of financial results for 2014
The statement of Financial Activities shows an excess of Income over Expenditure of £265,214.
After excluding depreciation of £2,824, the surplus is £268,038. The analysis of income and expenditure is shown in the pie charts below and is extracted from the report and accounts which are available via the link above.
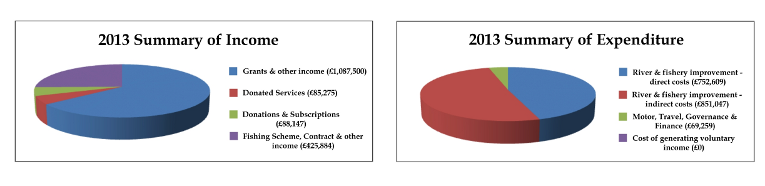
Summary of financial results for 2013
The statement of Financial Activities shows an excess of Income over Expenditure of £2,103.
After excluding depreciation of £11,787, the surplus is £13,890. The analysis of income and expenditure is shown in the pie charts below and is extracted from the report and accounts which are available via the link above.
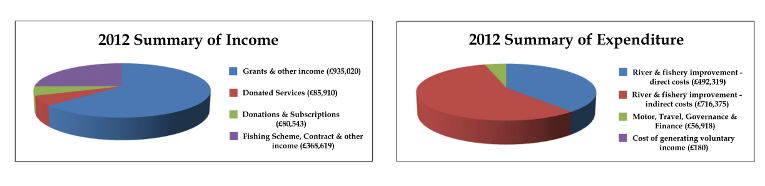
Summary of financial results for 2012
The statement of Financial Activities shows an excess of Income over Expenditure of £204,300.
After excluding depreciation of £18,085, the surplus is £222,385. The analysis of income and expenditure is shown in the pie charts below and is extracted from the report and accounts which are available via the link above.
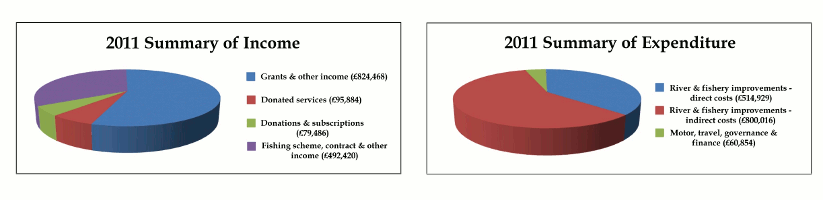
Summary of financial results for 2011
The statement of Financial Activities shows an excess of Income over Expenditure of £101,729.
After excluding depreciation of £14,730, the surplus is £116,459. The analysis of income and expenditure is shown in the pie charts below and is extracted from the report and accounts which are available via the link above.
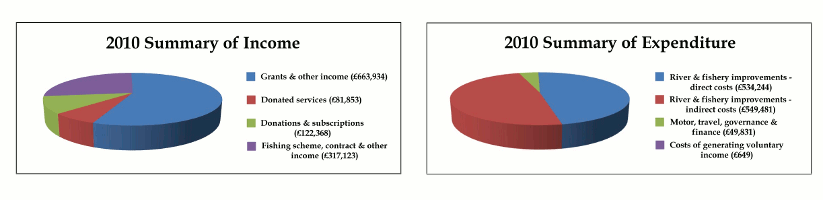
Summary of financial results for 2010
The statement of Financial Activities shows an excess of Income over Expenditure £55,284.
After including capital expenditure of £18,371, but excluding depreciation of £14,115, the surplus is £51,028. The analysis of income and expenditure is shown in the pie charts below and is extracted from the report and accounts which are available via the link above.
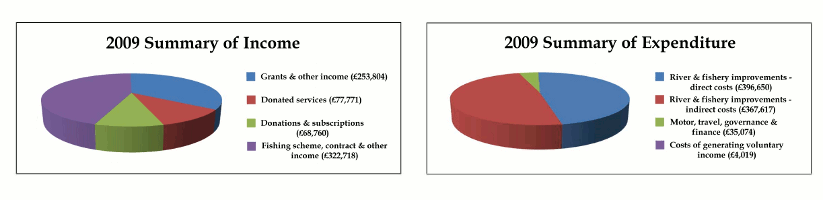
Summary of financial results for 2009
The statement of Financial Activities shows an excess of Expenditure over Income of £60,901.
After including capital expenditure of £35,739, but excluding depreciation of £16,243, the deficit is £80,397. The analysis of income and expenditure is shown in the pie charts below and is extracted from the report and accounts which are available via the link above.
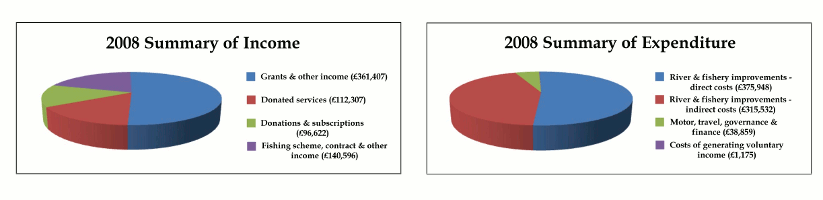
Summary of financial results for 2008
The statement of Financial Activities shows an excess of Expenditure over Income of £26,176.
After including capital expenditure of £2,800, but excluding depreciation of £8,394, the deficit is £20,582. The analysis of income and expenditure is shown in the pie charts below and is extracted from the report and accounts which are available via the link above.
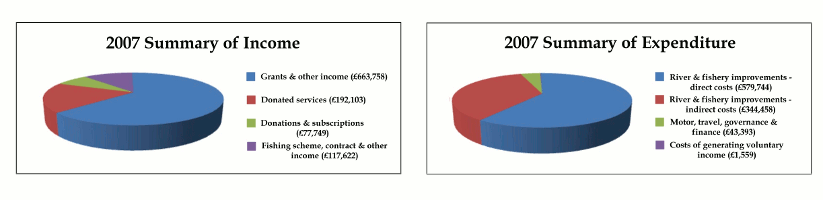
Summary of financial results for 2007
The statement of Financial Activities shows an excess of Income over Expenditure of £72,133.
After including capital expenditure of £5,562, but excluding depreciation of £15,507, the
surplus is £62,188.
The analysis of income and expenditure is shown in the pie charts below and is extracted from the report and
accounts, which are available on this site.
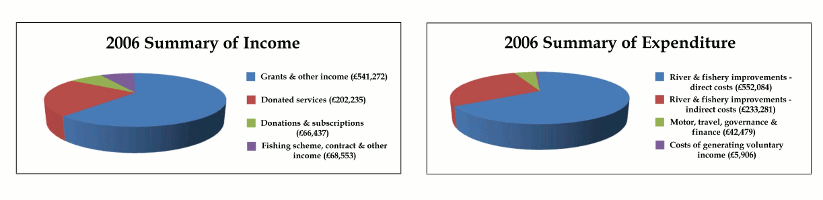
Summary of financial results for 2006
The statement of Financial Activities
shows an excess of Income over Expenditure of £46,585.
After including
capital expenditure of £18,252, but excluding depreciation of £16,414,
the surplus is £44,747.
The analysis of income and expenditure is shown
in the pie charts below and is extracted from the report and accounts,
which are available on the web site.
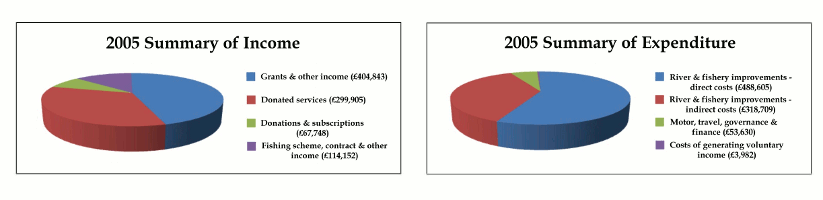
Summary of financial results for 2005
The statement of Financial Activities shows an excess of Income over Expenditure
of £11,357. After including capital expenditure of £6,541, but
excluding depreciation of £16,906 the surplus is £21,722.
The analysis of income and expenditure is shown in the pie charts below:-
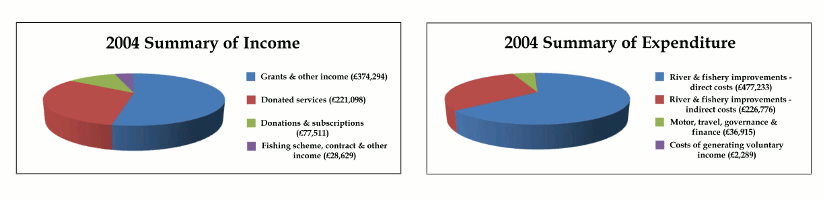
Summary of financial results for 2004
The statement of Financial Activities shows an excess of Expenditure over Income of £28,465.
After including capital expenditure of £27,877, but excluding depreciation of £14,661 the
deficit is £41,681.
The analysis of income and expenditure is shown in the pie charts below and has been revised to reflect SORP
2005.